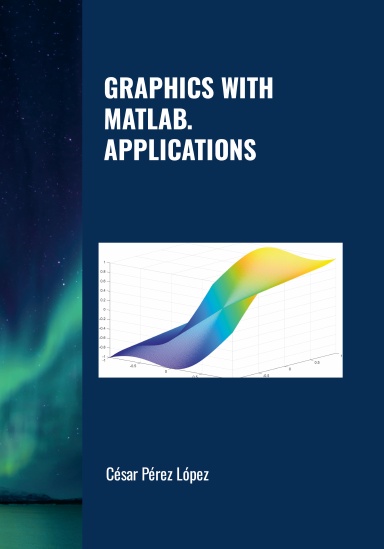
GRAPHICS WITH MATLAB. APPLICATIONS
Usualmente se imprime en 3 - 5 días hábiles
MATLAB is a scientific software that implements high-performance graphics capabilities. It allows for the creation of simple plots for exploratory data analysis in two and three dimensions, plots of curves in explicit, implicit, and polar coordinates, plots of surfaces in explicit, implicit, and parametric coordinates, plots of meshes and contour lines, plots of volumes, and specialized plots. Furthermore, it is possible to choose windows and positions for plots, select characteristics of lines and markers, set axis limits, tick marks, and grids, add annotations, labels, and legends, export plots to various formats, and explore other possibilities that will be presented throughout the book. Finally, MATLAB's graphical representations facilitate the calculation of limits, derivatives, and integrals. These plots are especially helpful when defining regions to calculate areas and volumes using integrals. Throughout the book, a wide variety of examples and solved exercises using MATLAB are presented.
Detalles
- Fecha de publicación
- Jul 24, 2026
- Idioma
- English
- ISBN
- 9781291596991
- Categoría
- Computadoras y tecnología
- Copyright
- Todos los derechos reservados - Licencia estándar de copyright
- Contribuyentes
- Por (autor o autora): Cesar Perez Lopez
Especificaciones
- Páginas
- 235
- Tipo de encuadernación
- Tapa blanda Tapa blanda
- Color de interior
- Blanco y negro
- Dimensiones
- Ejecutivo (7 x 10 in / 178 x 254 mm)