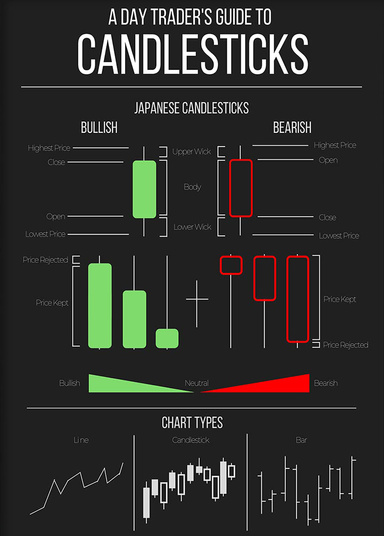
A DAY TRADER'S GUIDE TO CANDLESTICKS PATTERNS
THE ULTIMATE GUIDE TO SUCCESSFUL TRADING
This ebook may not meet accessibility standards and may not be fully compatible with assistive technologies.
What are Candlesticks?
Put simply, candlesticks are a way of communicating information about how price is moving. Candlestick charts are available on ThinkForex trading platforms for all assets individuals can trade on the platforms
Why do Candlesticks Work?
Price action traders rely on candlesticks because they convey a great deal of information about each trading period in a visual format that is easy to interpret, allowing traders to compare the behavior of price in different time periods with a quick glance at a price action chart. Each candlestick can be “read” as a meaningful part of the developing narrative of price. They communicate the “market sentiment”: whether (and to what extent) bears or bulls were in control, and how far traders managed to push price in both directions. For example, a long candle’s body with no wicks indicates a definitive shift in this struggle for power, whereas a candle with a long upper wick beyond its body indicates a more contentious period with an effort by bulls to push price higher that was pushed back by pressure from bears before the close of the candle. Certain re-occurring candlestick patterns have become popular among traders as reliable signals of future market behavior. This guide is intended as an introduction to some of these patterns, which helptraders make sense of market conditions and recognize advantageous times to enter trades. The ability to read candlesticks allows the price action trader to become a meta-strategist, taking into account the behaviors of other traders and large-scale market-movers. In other words, candlestick patterns help traders.
What are Candlesticks?
Calibrate their own trading with the fluctuations and reversals of larger, more influential participants in market, often referred to as “Smart Money”, so that traders can identify and participate in significant price moves. The chart below demonstrates some of the innumerable patterns formed by candlesticks in the context of a daily price action chart. These patterns will be discussed and elaborated upon in the remainder of this guide.
Details
- Publication Date
- Apr 11, 2025
- Language
- English
- ISBN
- 9781326521592
- Category
- Business & Economics
- Copyright
- All Rights Reserved - Standard Copyright License
- Contributors
- By (author): Auron Lexwyn
Specifications
- Format
- EPUB