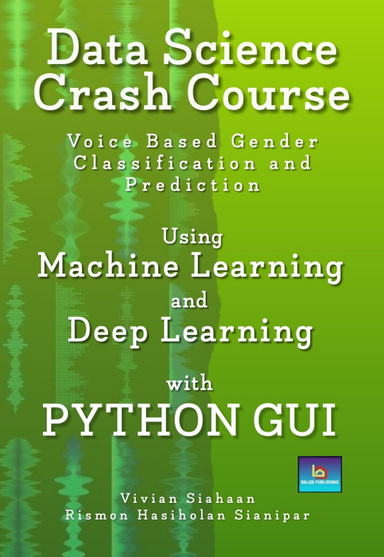
DATA SCIENCE CRASH COURSE: Voice Based Gender Classification and Prediction Using Machine Learning and Deep Learning with Python GUI
ByVivian SiahaanRismon Hasiholan Sianipar
This ebook may not meet accessibility standards and may not be fully compatible with assistive technologies.
This dataset was created to identify a voice as male or female, based upon acoustic properties of the voice and speech. The dataset consists of 3,168 recorded voice samples, collected from male and female speakers. The voice samples are pre-processed by acoustic analysis in R using the seewave and tuneR packages, with an analyzed frequency range of 0hz-280hz (human vocal range).
The following acoustic properties of each voice are measured and included within the CSV: meanfreq: mean frequency (in kHz); sd: standard deviation of frequency; median: median frequency (in kHz); Q25: first quantile (in kHz); Q75: third quantile (in kHz); IQR: interquantile range (in kHz); skew: skewness; kurt: kurtosis; sp.ent: spectral entropy; sfm: spectral flatness; mode: mode frequency; centroid: frequency centroid (see specprop); peakf: peak frequency (frequency with highest energy); meanfun: average of fundamental frequency measured across acoustic signal; minfun: minimum fundamental frequency measured across acoustic signal; maxfun: maximum fundamental frequency measured across acoustic signal; meandom: average of dominant frequency measured across acoustic signal; mindom: minimum of dominant frequency measured across acoustic signal; maxdom: maximum of dominant frequency measured across acoustic signal; dfrange: range of dominant frequency measured across acoustic signal; modindx: modulation index. Calculated as the accumulated absolute difference between adjacent measurements of fundamental frequencies divided by the frequency range; and label: male or female.
The models used in this project are K-Nearest Neighbor, Random Forest, Naive Bayes, Logistic Regression, Decision Tree, Support Vector Machine, Adaboost, LGBM classifier, Gradient Boosting, XGB classifier, MLP classifier, and CNN 1D. Finally, you will develop a GUI using PyQt5 to plot boundary decision, ROC, distribution of features, feature importance, cross validation score, and predicted values versus true values, confusion matrix, learning curve, performance of the model, scalability of the model, training loss, and training accuracy.
Details
- Publication Date
- Mar 30, 2023
- Language
- English
- Category
- Computers & Technology
- Copyright
- All Rights Reserved - Standard Copyright License
- Contributors
- By (author): Vivian Siahaan, By (author): Rismon Hasiholan Sianipar
Specifications
- Format